Modern technology for climate data and analysis
Hello and welcome!
This site contains my projects I have worked on from analyzing to visualizing data. If you would like to download any of the code used in this site visit my Github.
3D visualization of GODAS data
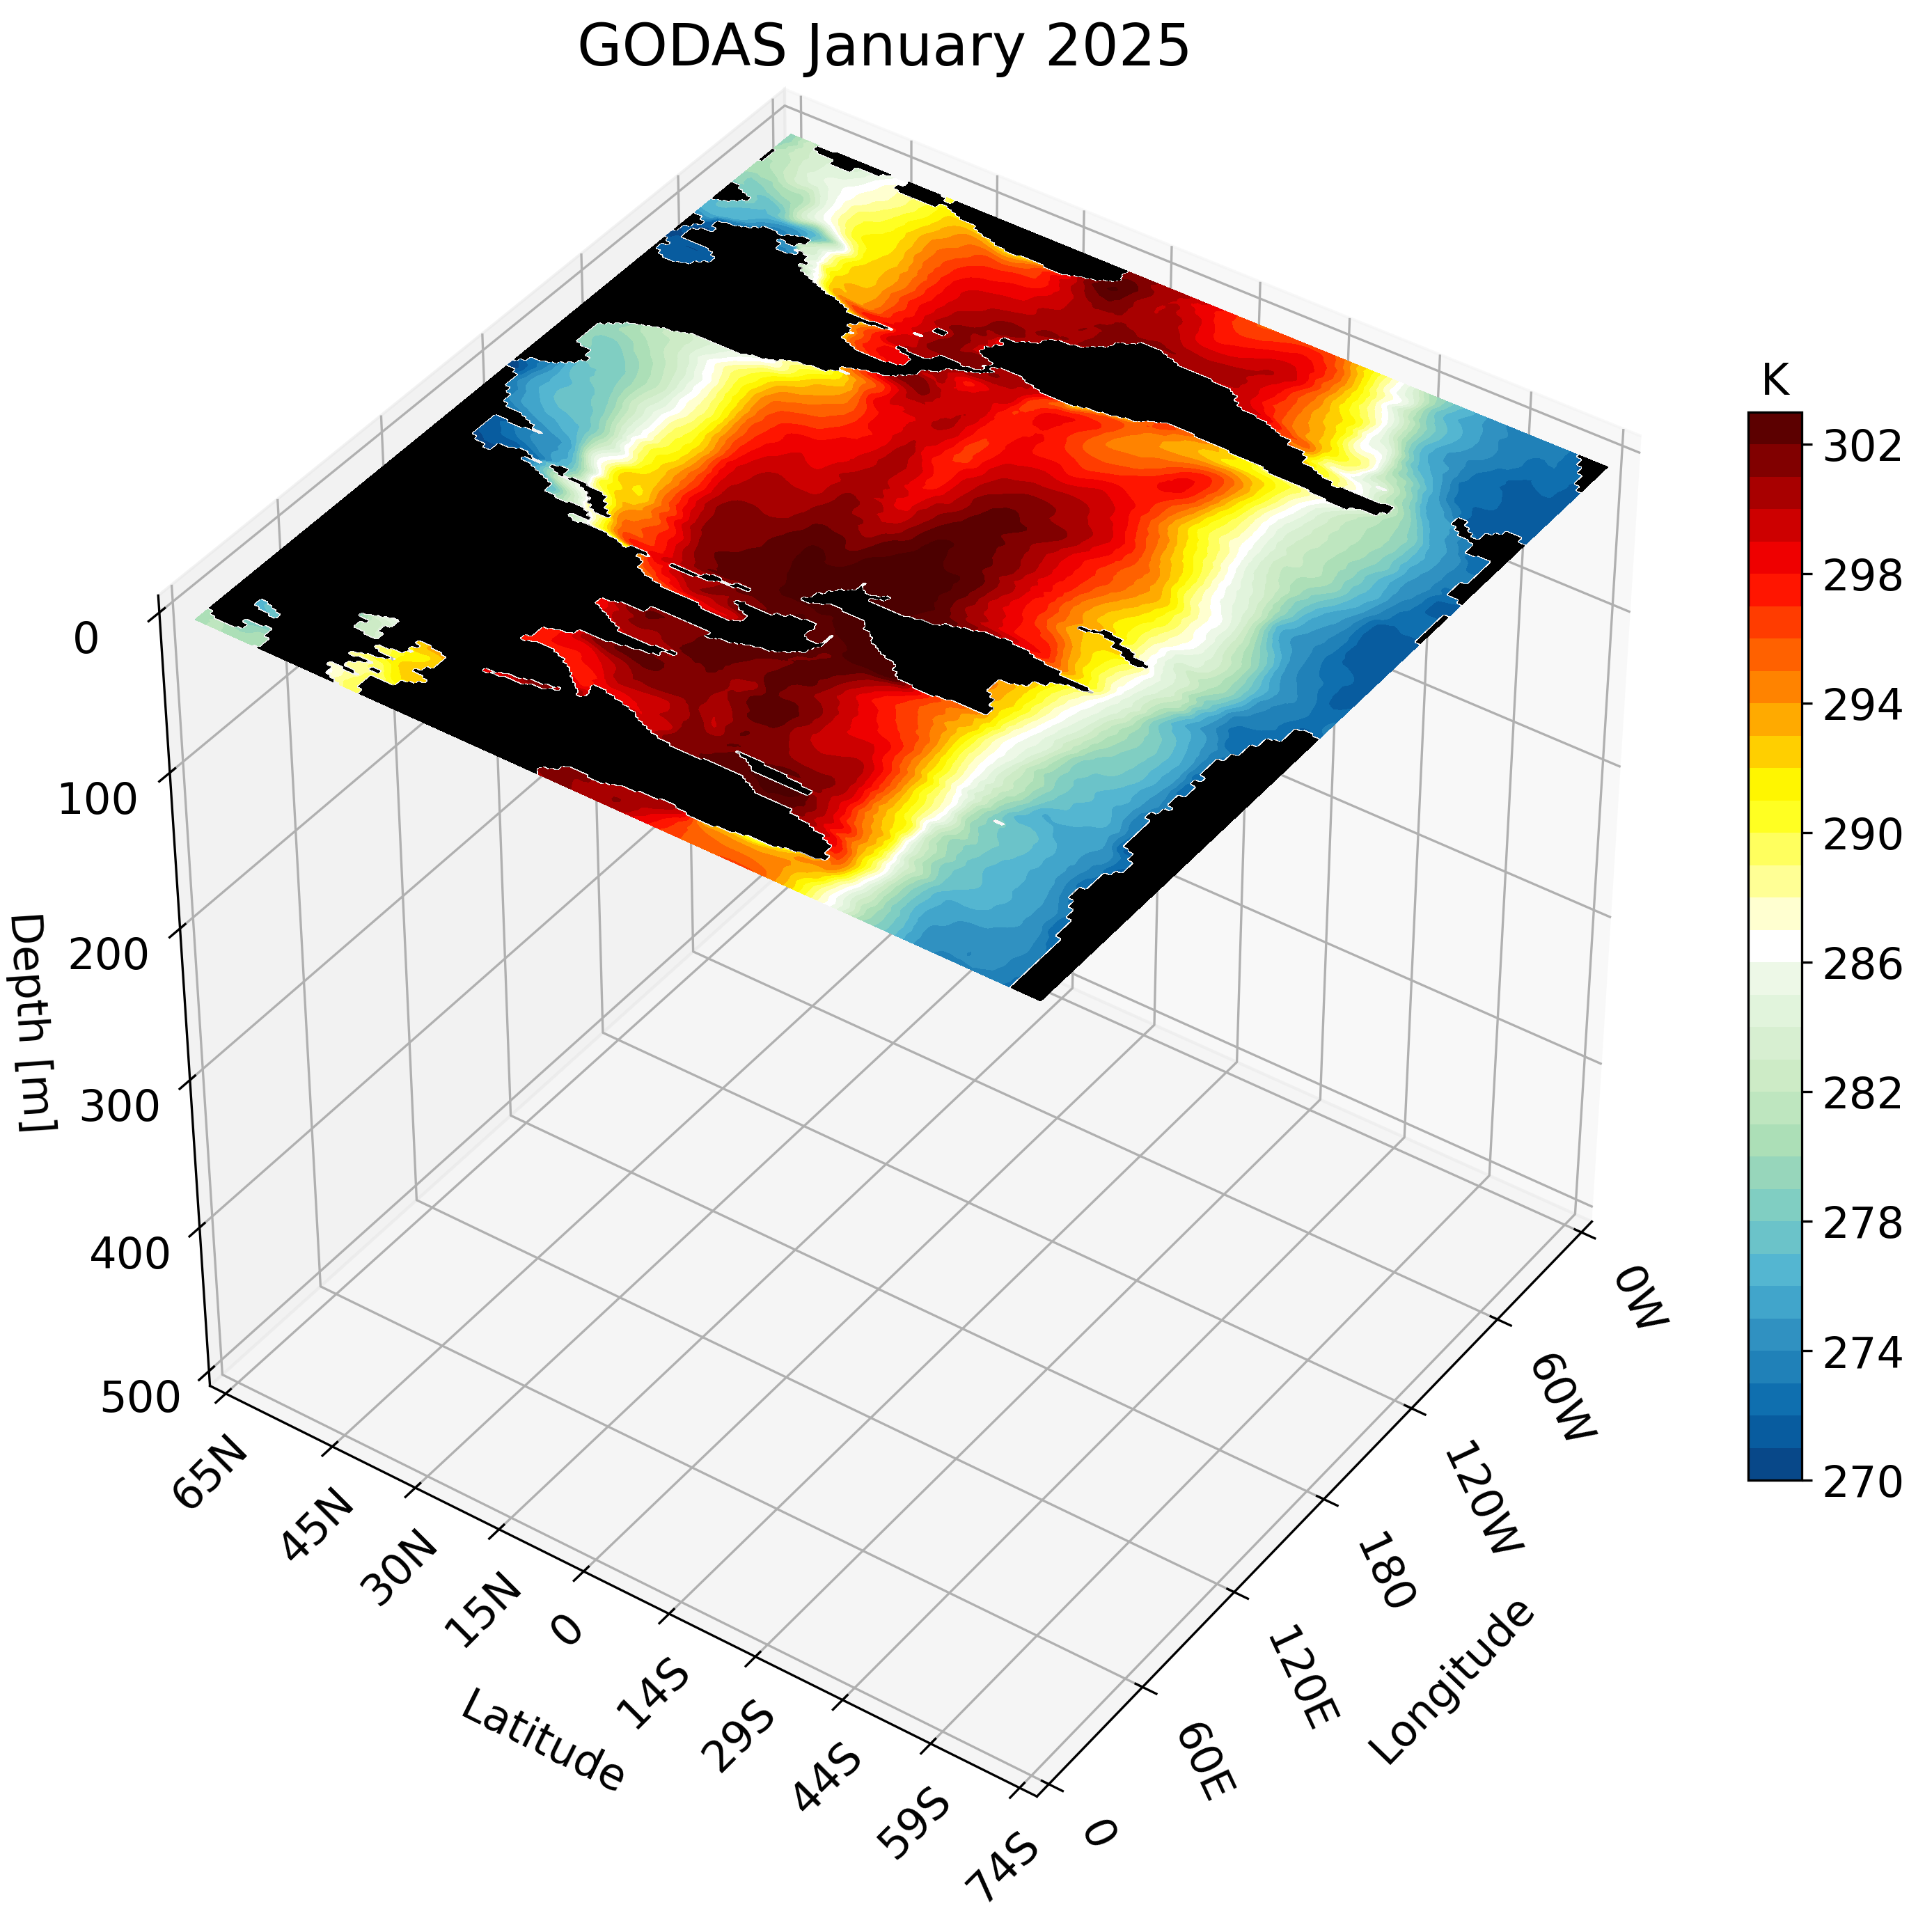
Motivation The Global Ocean Data Assimilation System (GODAS) is a readily available dataset that can be downloaded directly from NOAA’s Physical Sciences Laboratory website. We take advantage of this data’s accessibility to create a 3D visualization. The visualization tools we use are the same as those used in this post and this post. The full ... Read more 24 Mar 2026 - 17 minute read
3D animation of regional cross-sections for high-resolution climate data
Motivation In the previous tutorial I taught you how to create 3D visualizations for zonal, meridional, and depth cross-sections. Though the cross-sections are great, sometimes they are hard to understand and intuitively place their location. For example, the meridional cut is tough to understand on its own: Meridional cross-section at 160E i... Read more 20 Mar 2026 - 23 minute read
3D visualization of high-resolution climate data
Motivation My previous 3D visualizations used Plotly, which was convenient and interactive, but it was limited in the amount of data it could handle. For my previous project, this was not an issue as the data was small. Multiple depths plotted for January climatology from OGCM. Once I started working with larger datasets, I found I was only ... Read more 02 Feb 2026 - 26 minute read
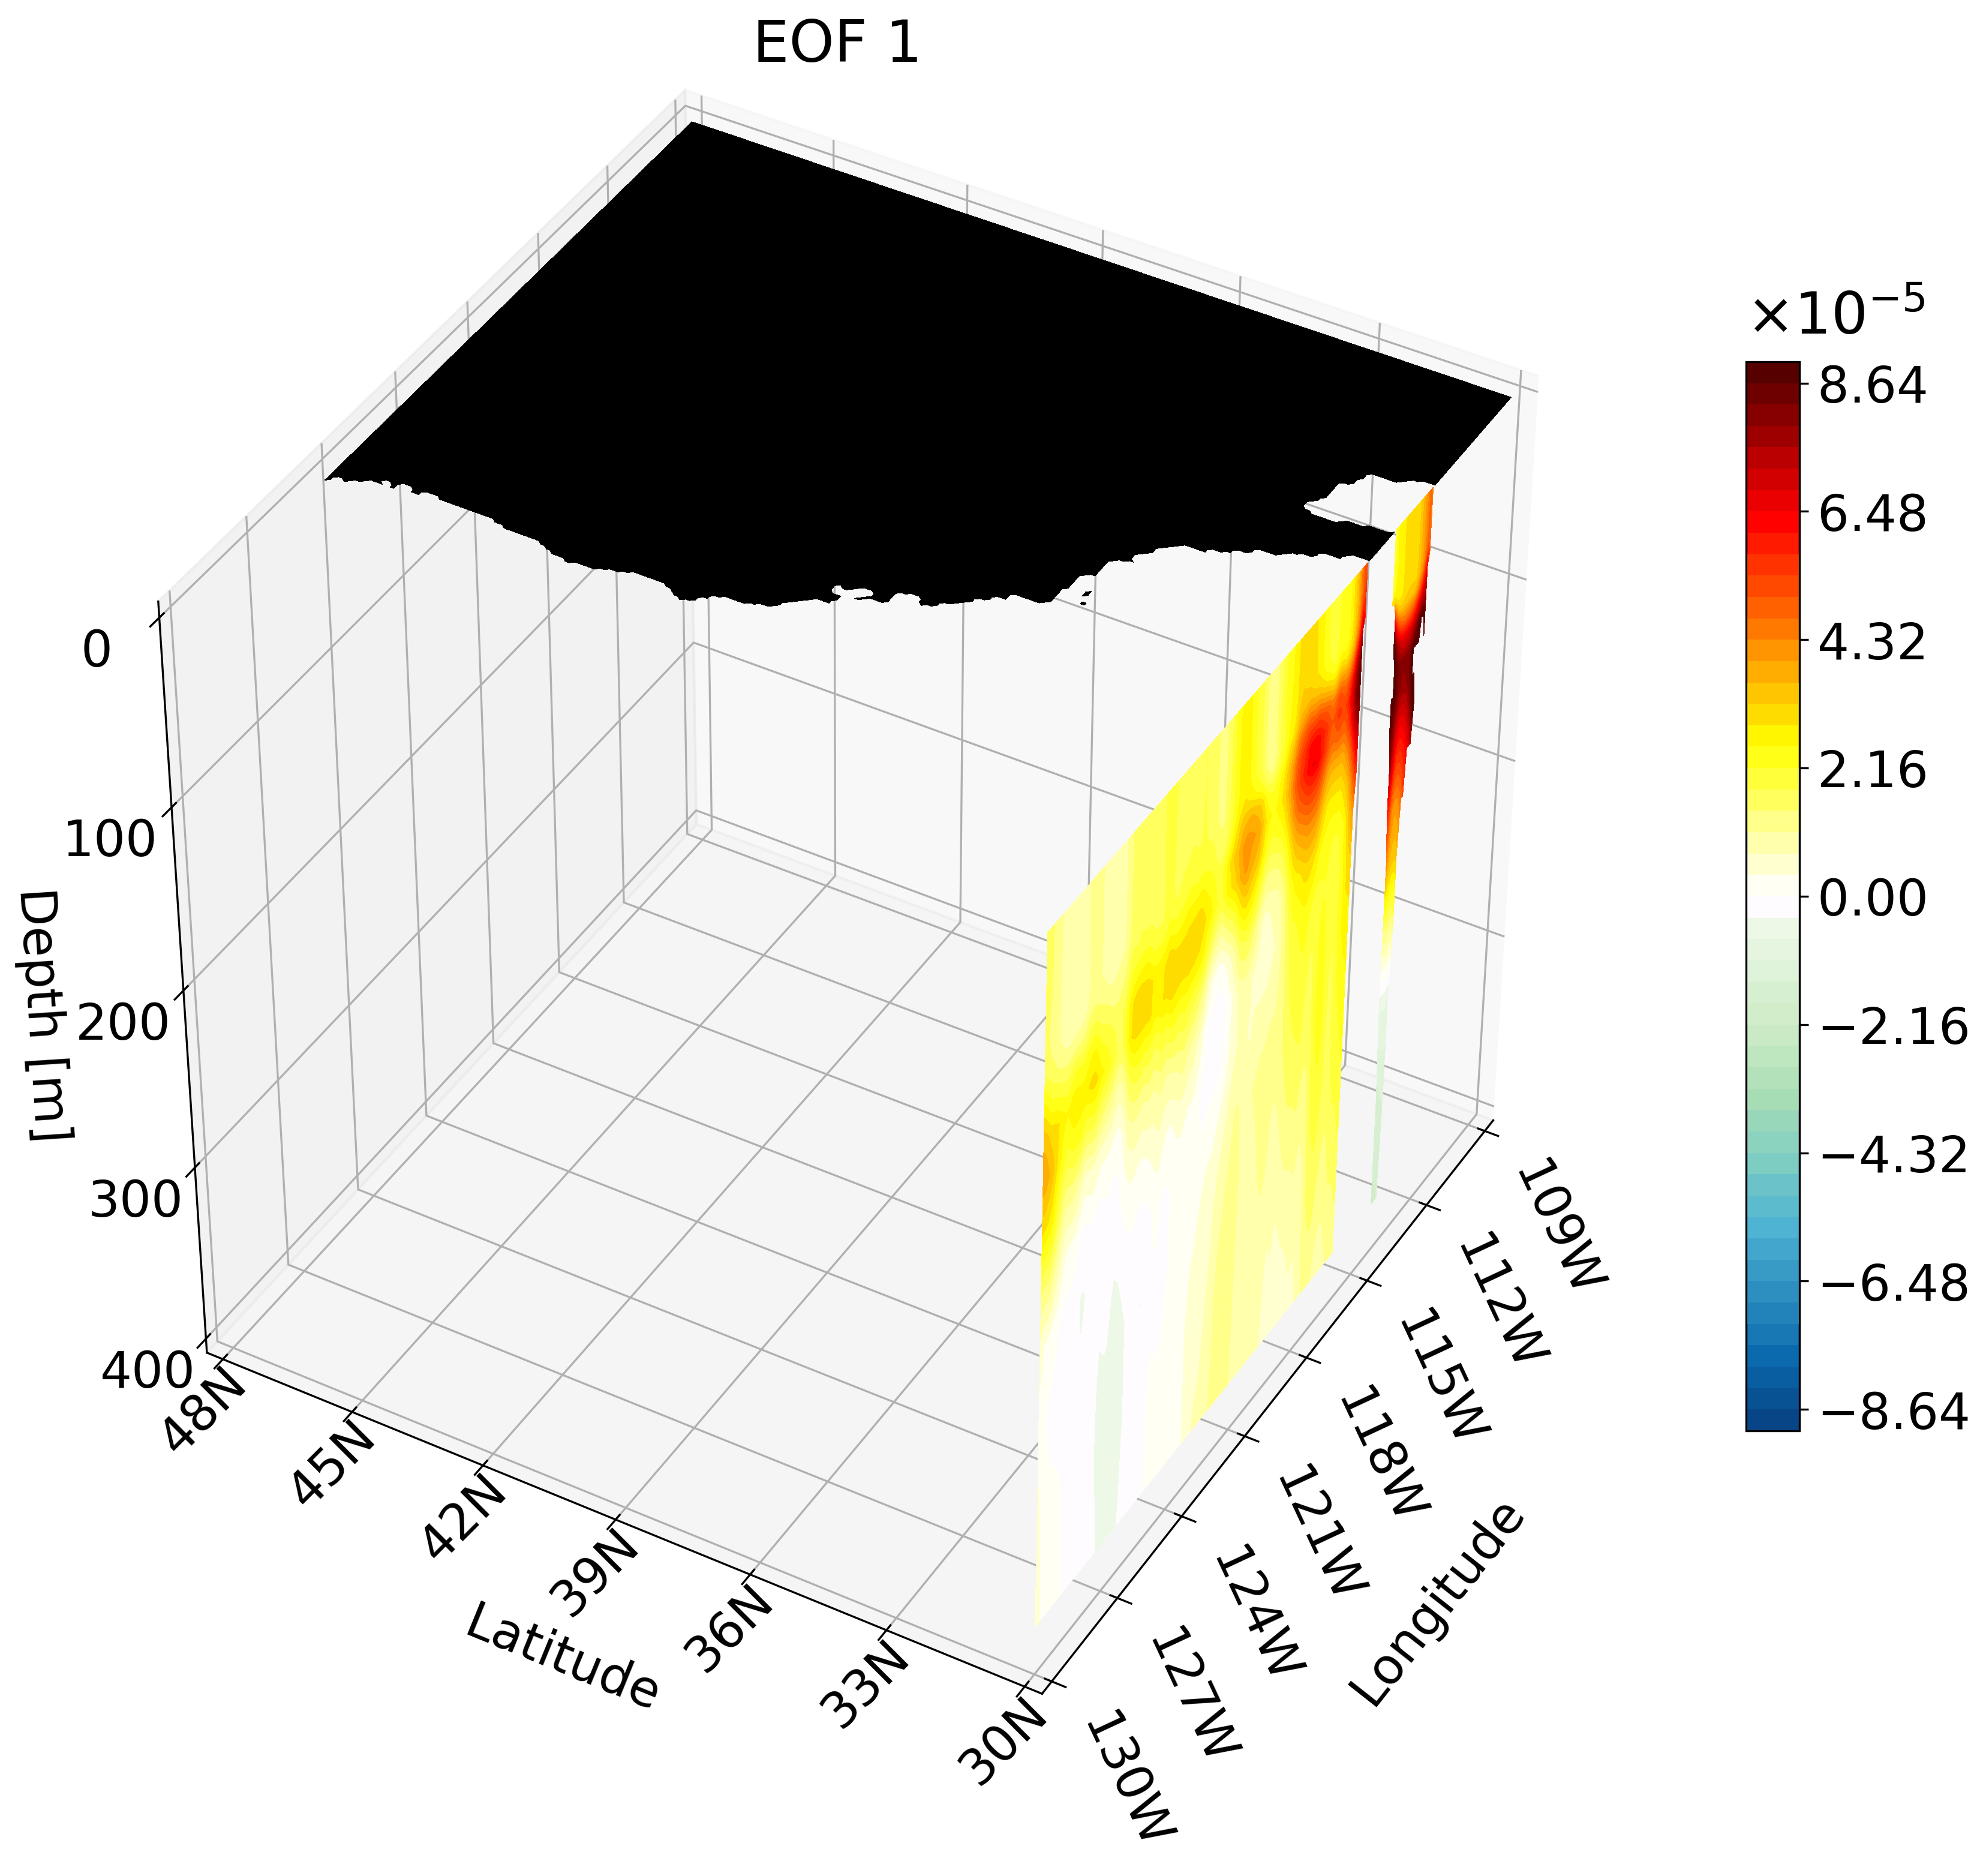
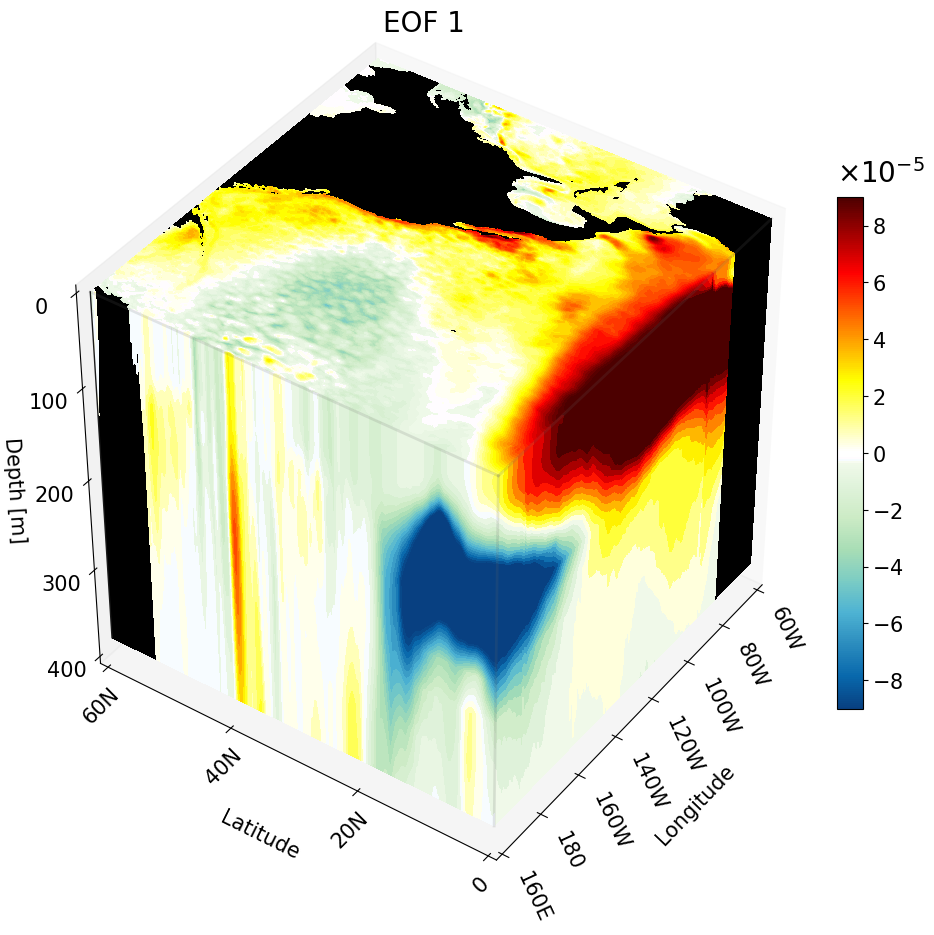
Computing 3D EOFs from NASA OGCM Using Covariance in Time and Singular Value Decomposition in Python
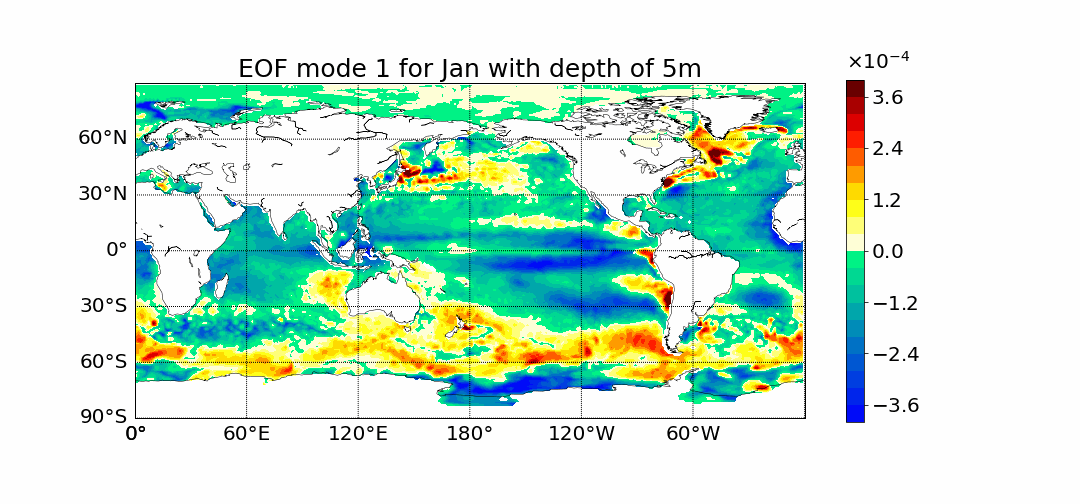
Motivation Existing oceanic studies on either data reconstruction or dynamics often used 2-dimensional empirical orthogonal functions (EOF) for sea surface temperature (SST) and for deep layers. However, large-scale oceanic dynamics, such as equatorial ocean upwelling and arctic ocean ventilation, implies the existence of strong covariance amon... Read more 09 Aug 2022 - 15 minute read